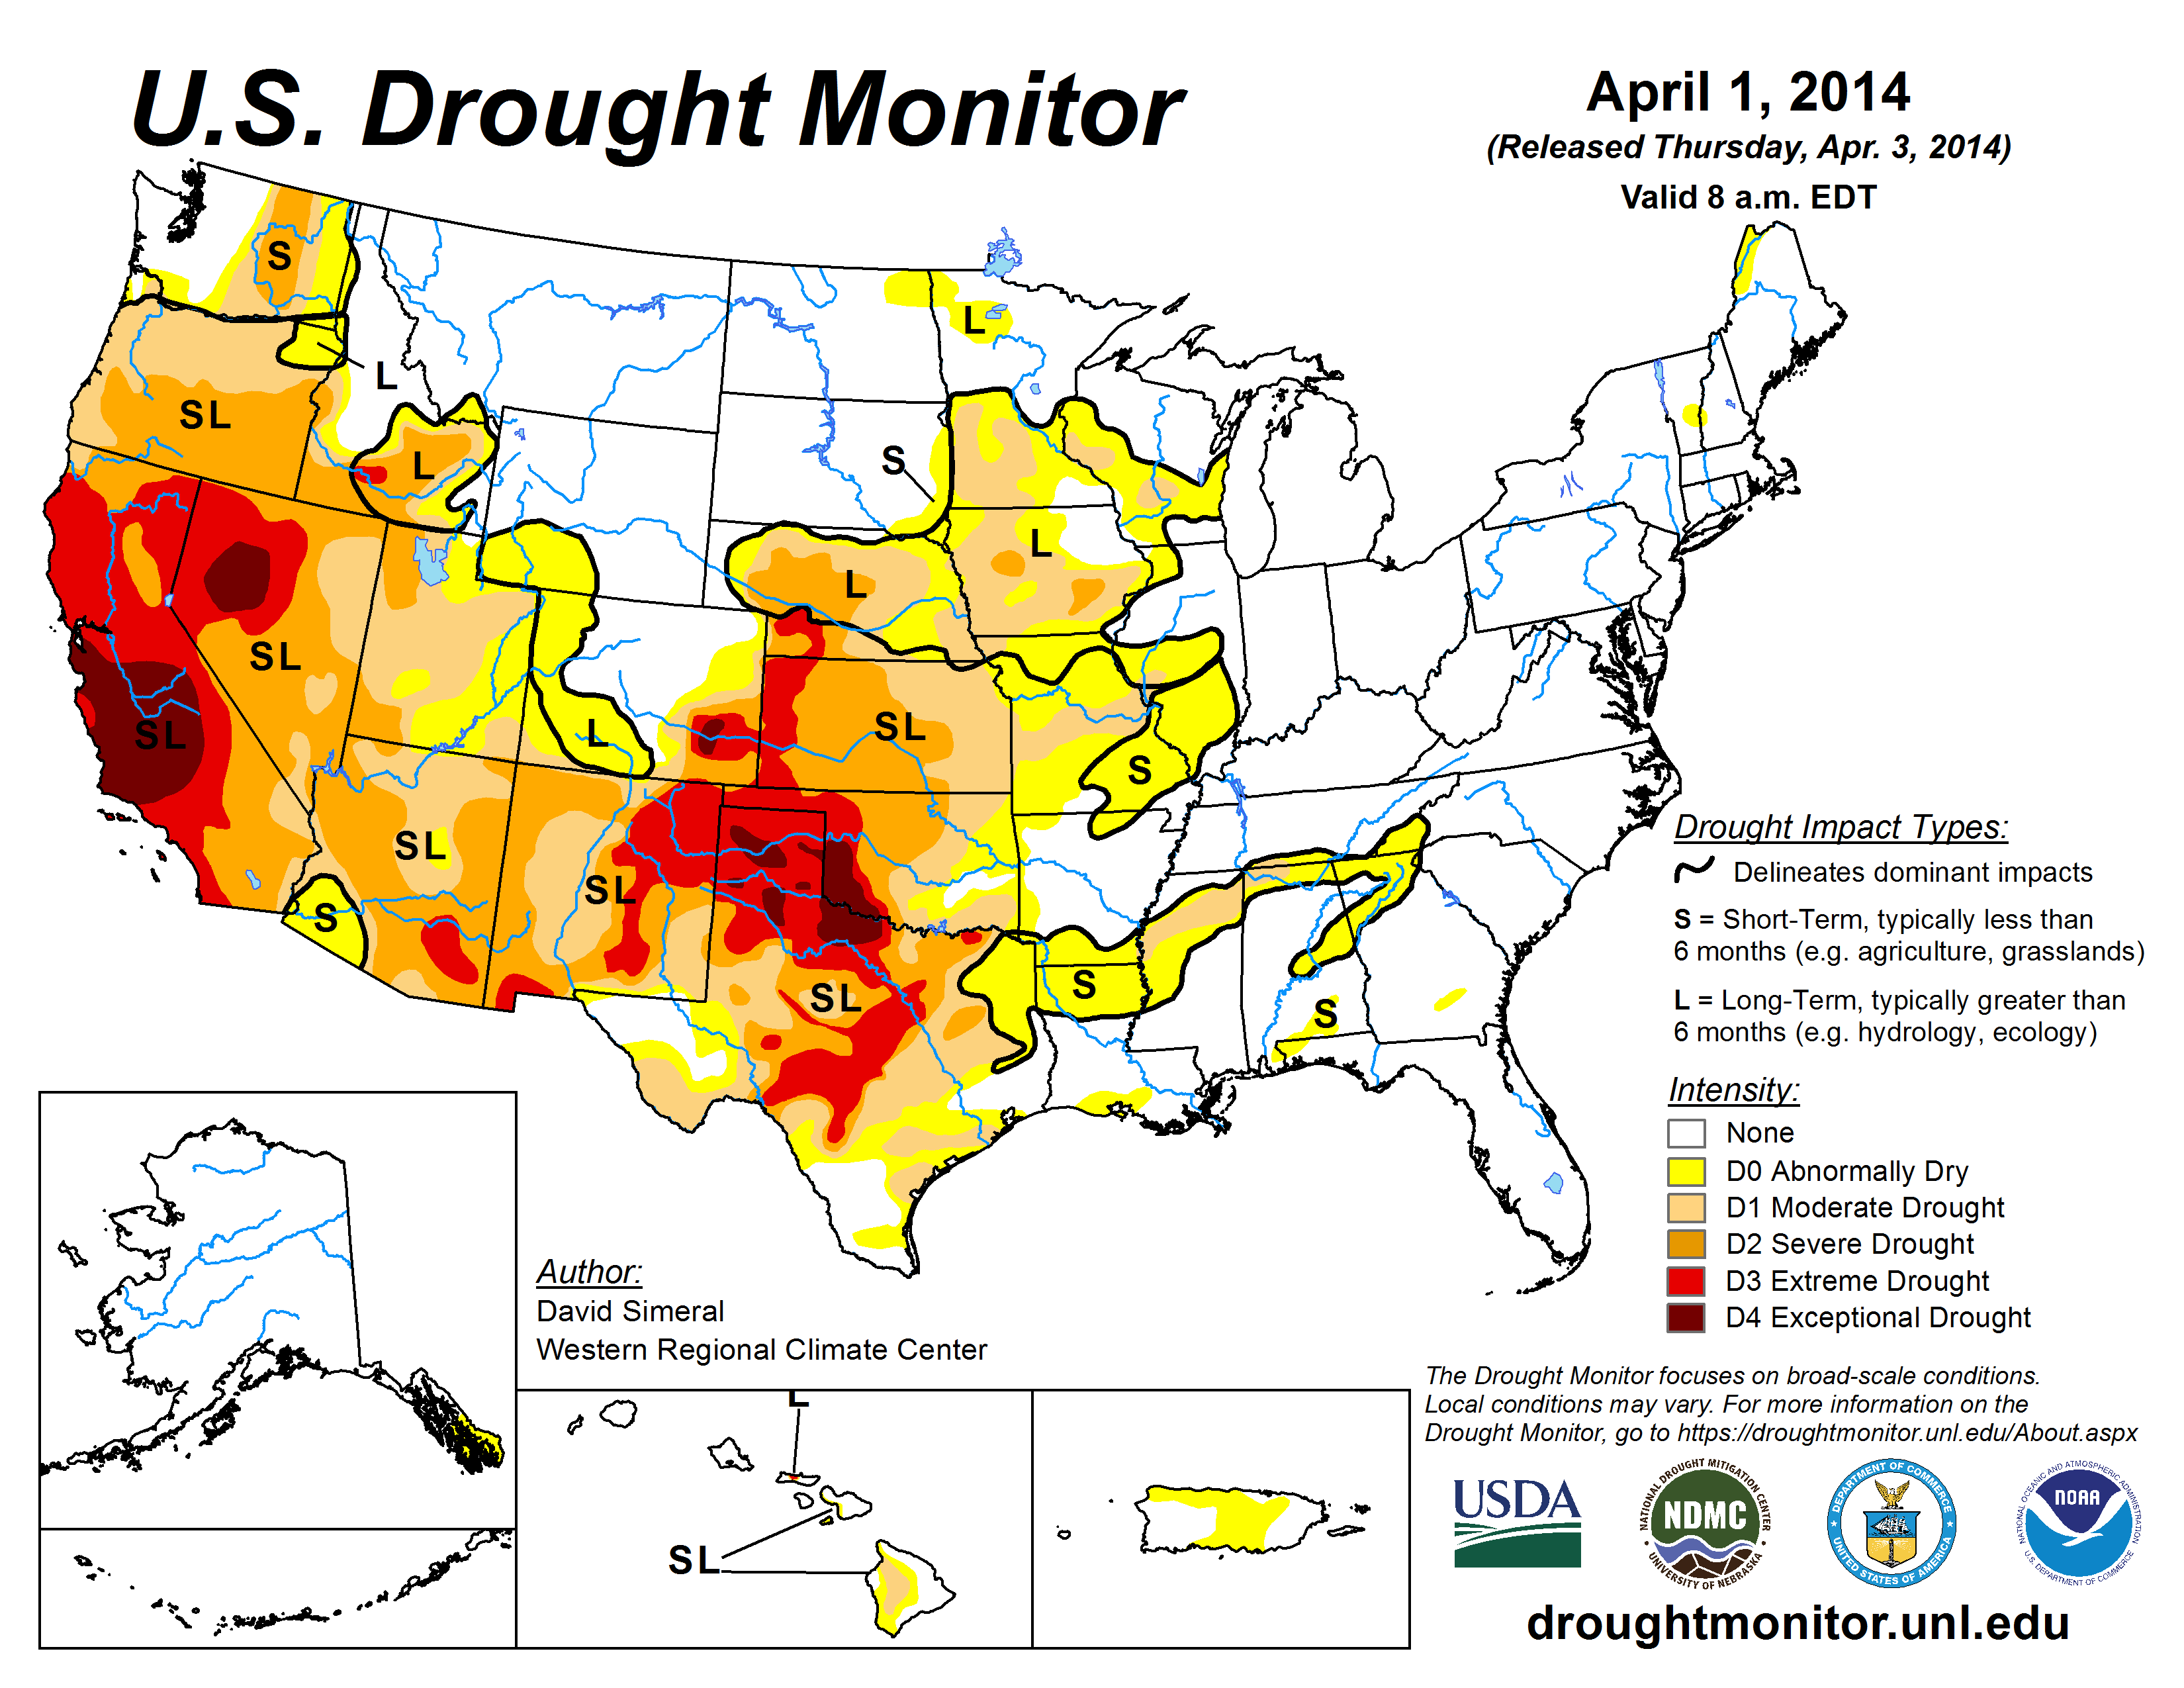
Drought coverage in the 48 contiguous states increased 2.52 percentage points to 38.37 in the four weeks that ended April 1. Drought coverage is at its highest point since Oct. 8, 2013, and up 7.42 percentage points from the beginning of the year, said Brad Rippey, meteorologist in the U.S. Department of Agriculture’s Office of the Chief Economist.
“Dry, windy, dusty conditions led to drought intensification on the southern Great Plains in March,” Rippey said. “In the four weeks ending April 1, coverage of extreme drought (D3) climbed from 8 to 14 percent in Kansas, while extreme to exceptional (D3-D4) drought coverage rose from 13 to 24 percent in Oklahoma and 7 to 10 percent in Texas.”
“California remained a drought focus during March, despite periods of rain and snow,” Rippey said. “The March precipitation offered some short-term benefits, such as aiding rain-fed crops, temporarily easing irrigation demands, and adding some water to drought-lowered reservoirs. However, California still faces a summer of reductions in water allocations, as the cumulative effects of the three-year drought on surface- and ground-water supplies continue to mount. During the four weeks ending April 1, California’s coverage of extreme to exceptional (D3-D4) drought increased slightly from 66 to 69 percent.”
Winter wheat is the main row crop affected by drought this time of year. The portion of the winter wheat crop in drought rose during March from 45 to 52 percent, mainly due to worsening drought across the southern half of the Great Plains, Rippey said. By March 30, well over half (59 percent) of the Texas wheat crop was rated by USDA in very poor to poor condition, along with 44 percent in Oklahoma, 33 percent in Colorado, and 25 percent in Kansas. In contrast, more than half of the winter wheat was rated in good to excellent conditions in several states, including South Dakota (58 percent good to excellent), Arkansas (56 percent), and Nebraska (55 percent).
U.S. Drought Monitor authors synthesize many drought indicators into a single map that identifies areas of the country that are abnormally dry (D0), in moderate drought (D1), in severe drought (D2), extreme drought (D3) and exceptional drought (D4). The map is released each week based on data through the previous Tuesday morning.
The U.S. Drought Monitor map is jointly produced by the National Drought Mitigation Center at the University of Nebraska-Lincoln, the National Oceanic and Atmospheric Administration, the USDA, and about 350 drought observers across the country.
Statistics for the percent area in each category of drought are automatically added to the U.S. Drought Monitor website each week for the entire country and Puerto Rico, for the 48 contiguous states, for each climate region, and for individual states. U.S. Drought Monitor data online goes back to January 2000.
http://drought.unl.edu/MonitoringTools/USDroughtMonitor/DroughtMonitorTips.aspx
U.S. Drought Monitor map, statistics and narrative summary: http://droughtmonitor.unl.edu
U.S. Ag in Drought
current: http://www.usda.gov/oce/weather/Drought/AgInDrought.pdf
archived: http://drought.unl.edu/Planning/Impacts/USAginDroughtArchive.aspx
U.S. Drought Monitor Change Maps:
http://droughtmonitor.unl.edu/DataArchive/ChangeMaps.aspx
Drought Impact Reporter: http://droughtreporter.unl.edu
National Drought Mitigation Center’s Monthly Drought and Impact Summary
http://drought.unl.edu/NewsOutreach/MonthlySummary.aspx
National Climatic Data Center’s State of the Climate Drought Summary:
http://www.ncdc.noaa.gov/sotc/drought/
U.S. Monthly Drought Outlook:
http://www.cpc.ncep.noaa.gov/products/expert_assessment/mdo_summary.html
U.S. Seasonal Drought Outlook:
http://www.cpc.ncep.noaa.gov/products/expert_assessment/sdo_summary.html
-- Kelly Helm Smith, National Drought Mitigation Center