While winter storms brought incremental relief, drought intensified in Oklahoma in the week that ended Dec. 10, 2013, according to the U.S. Drought Monitor.
The proportion of the contiguous 48 states in moderate drought or worse declined slightly to 30.28 percent from 30.59 percent a week earlier. “This represents the smallest areal coverage of drought in the contiguous U.S. since Dec. 27, 2011,” said Brad Rippey, meteorologist in the U.S. Department of Agriculture’s Office of the Chief Economist.
“Hay in drought (21 percent of the production area) and cattle in drought (34 percent of the U.S. inventory) were unchanged from a week ago,” Rippey said. “The portion of the winter wheat production area in drought inched upward one percentage point to 31 percent.”
Drought improved in several patches in Texas and in Nebraska, Minnesota, Utah, and Montana.
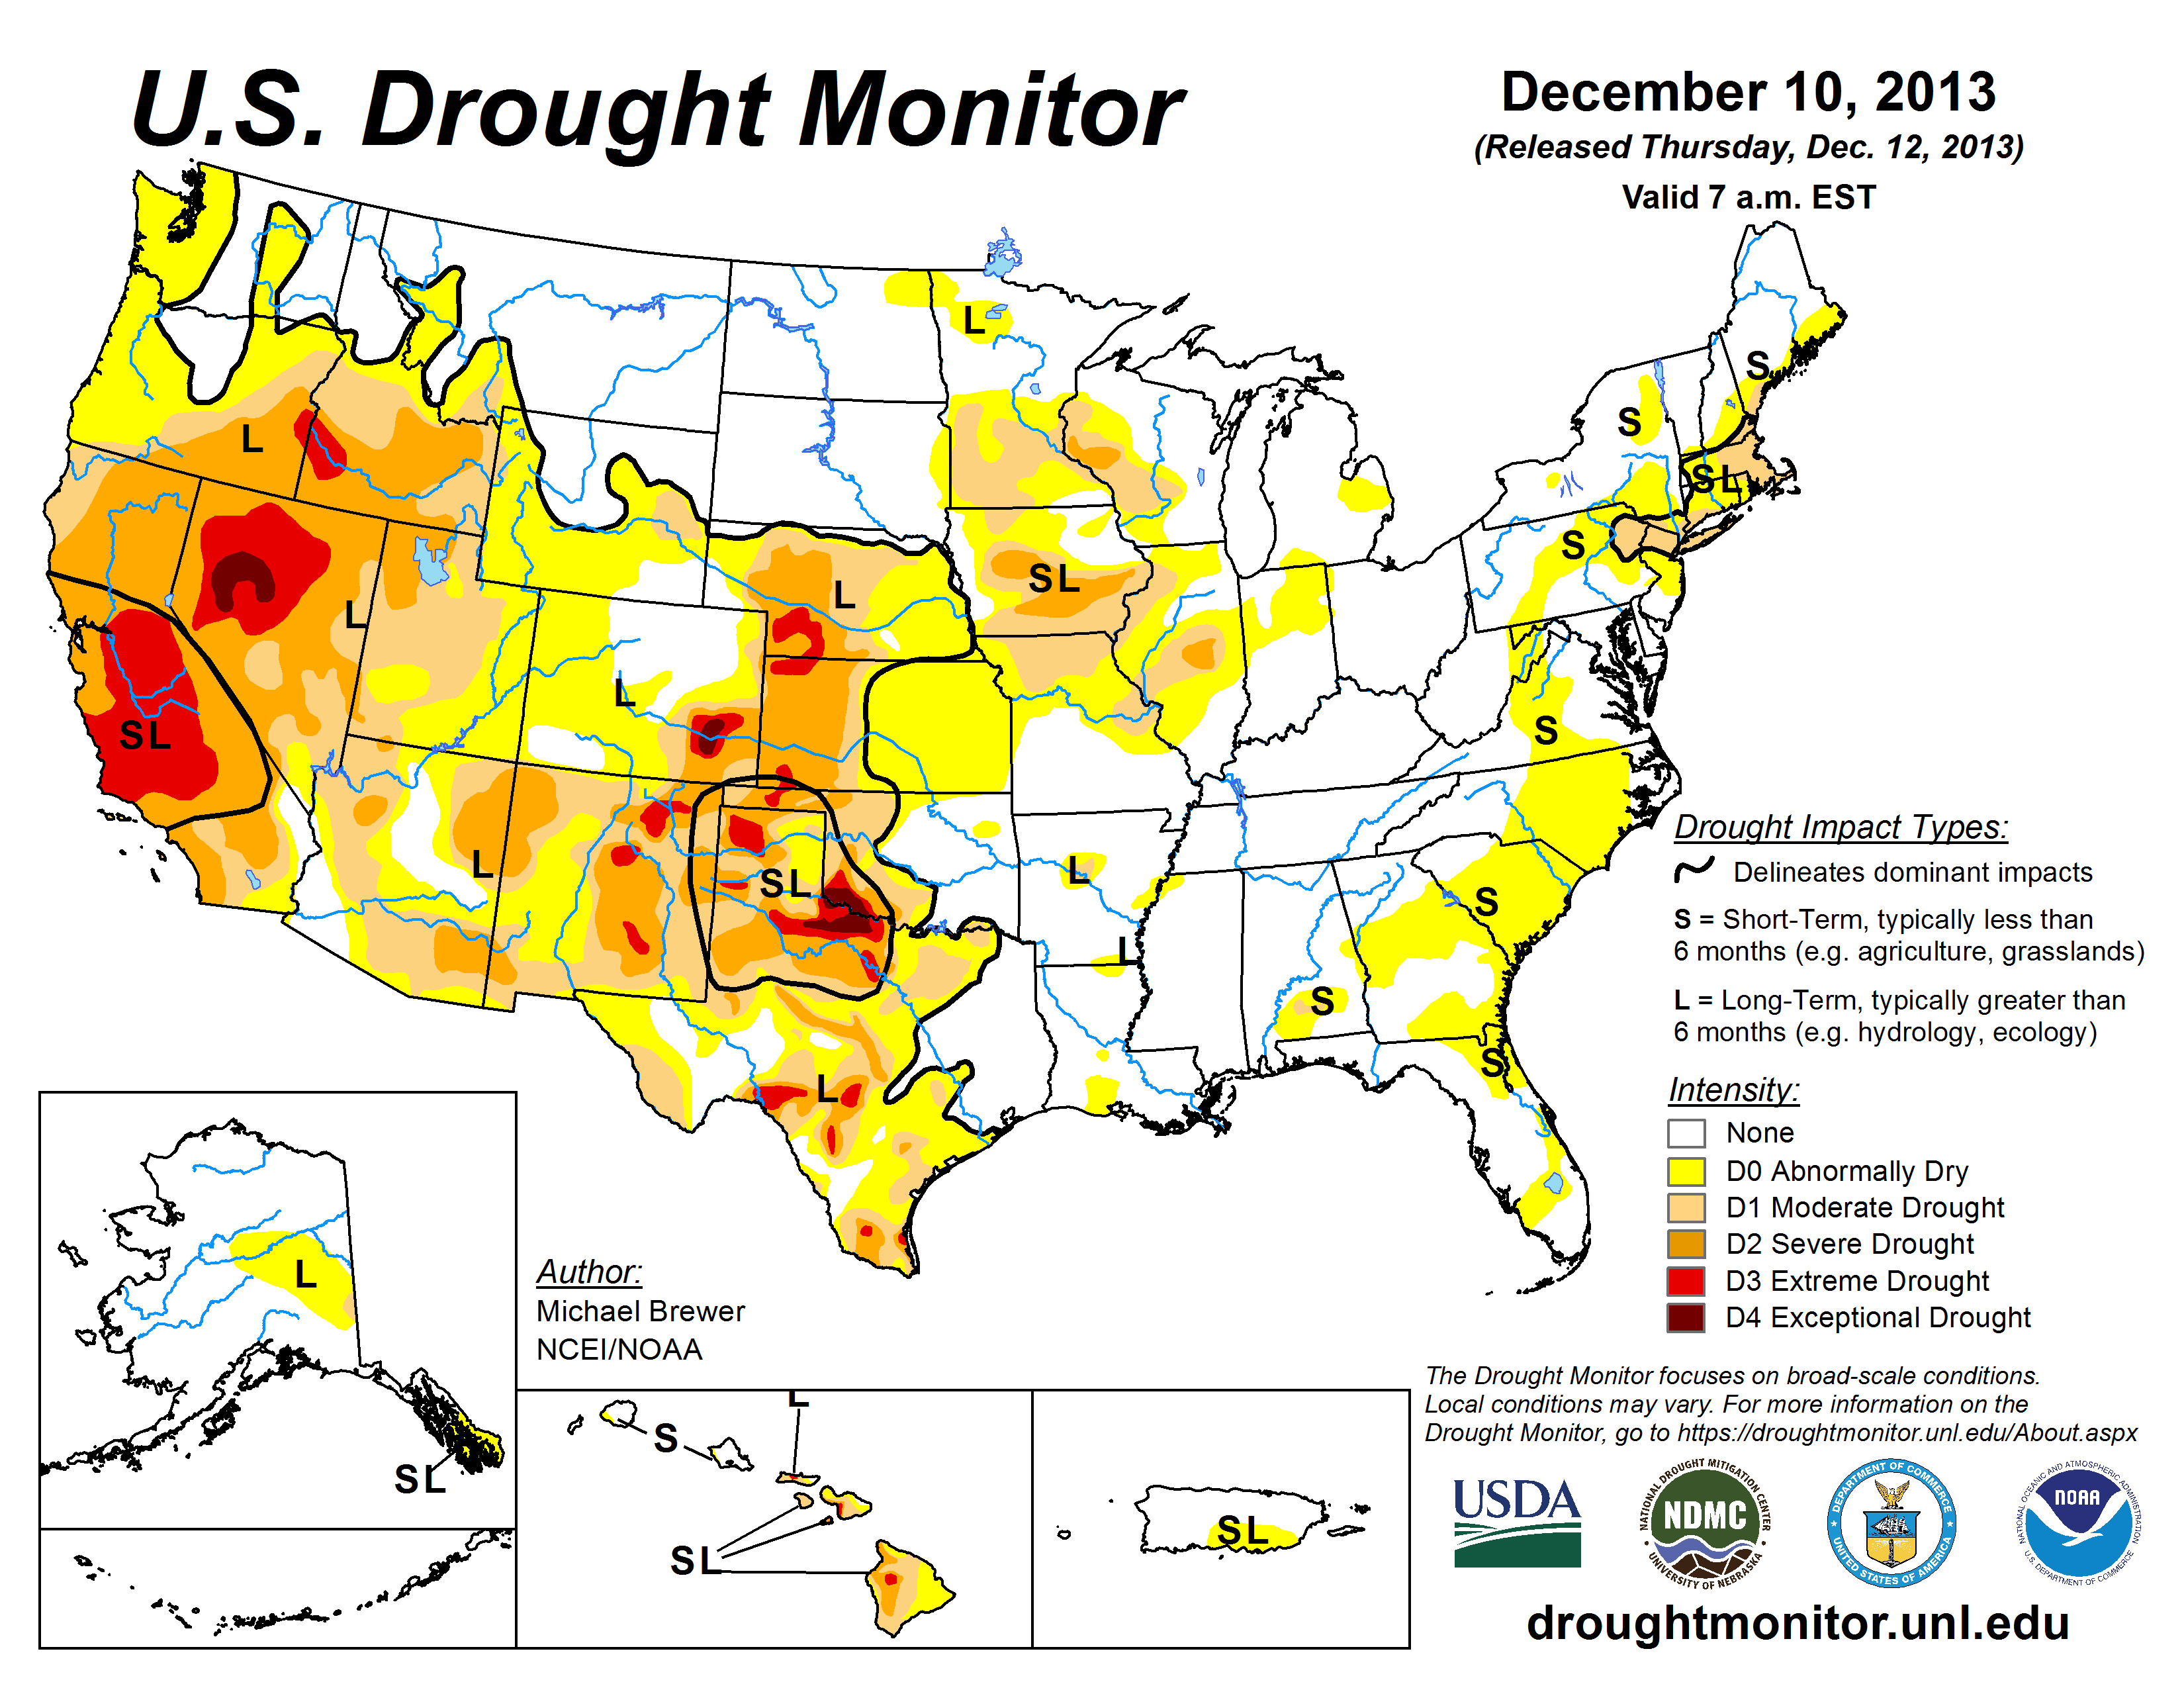
Moderate drought expanded in Oklahoma, and severe and moderate drought expanded in a small area in central Texas, where Lake Brownwood is below 58 percent full and has instituted stage 2 drought restrictions, according to Michael J. Brewer, this week’s U.S. Drought Monitor author, in narrative accompanying the map.
“It is worth noting that serious drought persists in several parts of the country,” Rippey said. “Notably, California and the Great Basin are entering a potential third year of drought. On December 10, severe to exceptional drought (D2 to D4) covered 83 percent of California and 78 percent of Nevada. In addition, drought remains a threat to rangeland, pastures, and winter wheat on the southern High Plains.”
The U.S. Drought Monitor, which is not considered the official source of drought declarations in California, has shown significant portions of the state in various degrees of drought since January 2012.
U.S. Drought Monitor authors synthesize many drought indicators into a single map that identifies areas of the country that are abnormally dry (D0), in moderate drought (D1), in severe drought (D2), extreme drought (D3) and exceptional drought (D4). The map is released each week based on data through the previous Tuesday morning.
The U.S. Drought Monitor map is jointly produced by the National Drought Mitigation Center at the University of Nebraska-Lincoln, the National Oceanic and Atmospheric Administration, the USDA, and about 350 drought observers across the country. Brewer is with NOAA’s National Climatic Data Center.
Statistics for the percent area in each category of drought are automatically added to the U.S. Drought Monitor website each week for the entire country and Puerto Rico, for the 48 contiguous states, for each climate region, and for individual states. U.S. Drought Monitor data online goes back to January 2000.
http://drought.unl.edu/MonitoringTools/USDroughtMonitor/DroughtMonitorTips.aspx
U.S. Drought Monitor map, statistics and narrative summary: http://droughtmonitor.unl.edu
U.S. Ag in Drought, current: http://www.usda.gov/oce/weather/Drought/AgInDrought.pdf
archived: http://drought.unl.edu/Planning/Impacts/USAginDroughtArchive.aspx
U.S. Drought Monitor Change Maps: http://droughtmonitor.unl.edu/DataArchive/ChangeMaps.aspx
Drought Impact Reporter: http://droughtreporter.unl.edu
National Drought Mitigation Center’s Monthly Drought and Impact Summary
http://drought.unl.edu/NewsOutreach/MonthlySummary.aspx
National Climatic Data Center’s State of the Climate Drought Summary:
http://www.ncdc.noaa.gov/sotc/drought/
U.S. Monthly Drought Outlook:
http://www.cpc.ncep.noaa.gov/products/expert_assessment/mdo_summary.html
U.S. Seasonal Drought Outlook:
http://www.cpc.ncep.noaa.gov/products/expert_assessment/sdo_summary.html
-- Kelly Helm Smith, National Drought Mitigation Center