Drought in the United States changed very little in the week that ended Dec. 3, according to the U.S. Drought Monitor.
“There was negligible change in U.S. drought coverage during the seven-day drought-monitoring period, as tranquil weather prevailed in the wake of a pre-Thanksgiving storm across the South and East,” said Brad Rippey, meteorologist in the U.S. Department of Agriculture’s Office of the Chief Economist. “On Dec. 3, drought coverage stood at 30.59 percent of the Lower 48 states. This is an increase of two one-hundredths of a percentage point from a week ago. There was improvement, however, in the Northeast region, with drought coverage declining in that 12-state area from 7.79 to 7.50 percent on the strength of heavy precipitation on Nov. 26 and 27.”
The biggest change was in Alaska, where above-normal precipitation almost completely eliminated a patch of moderate drought that covered 5 percent of the state a week earlier, and more than a quarter of the state in August.
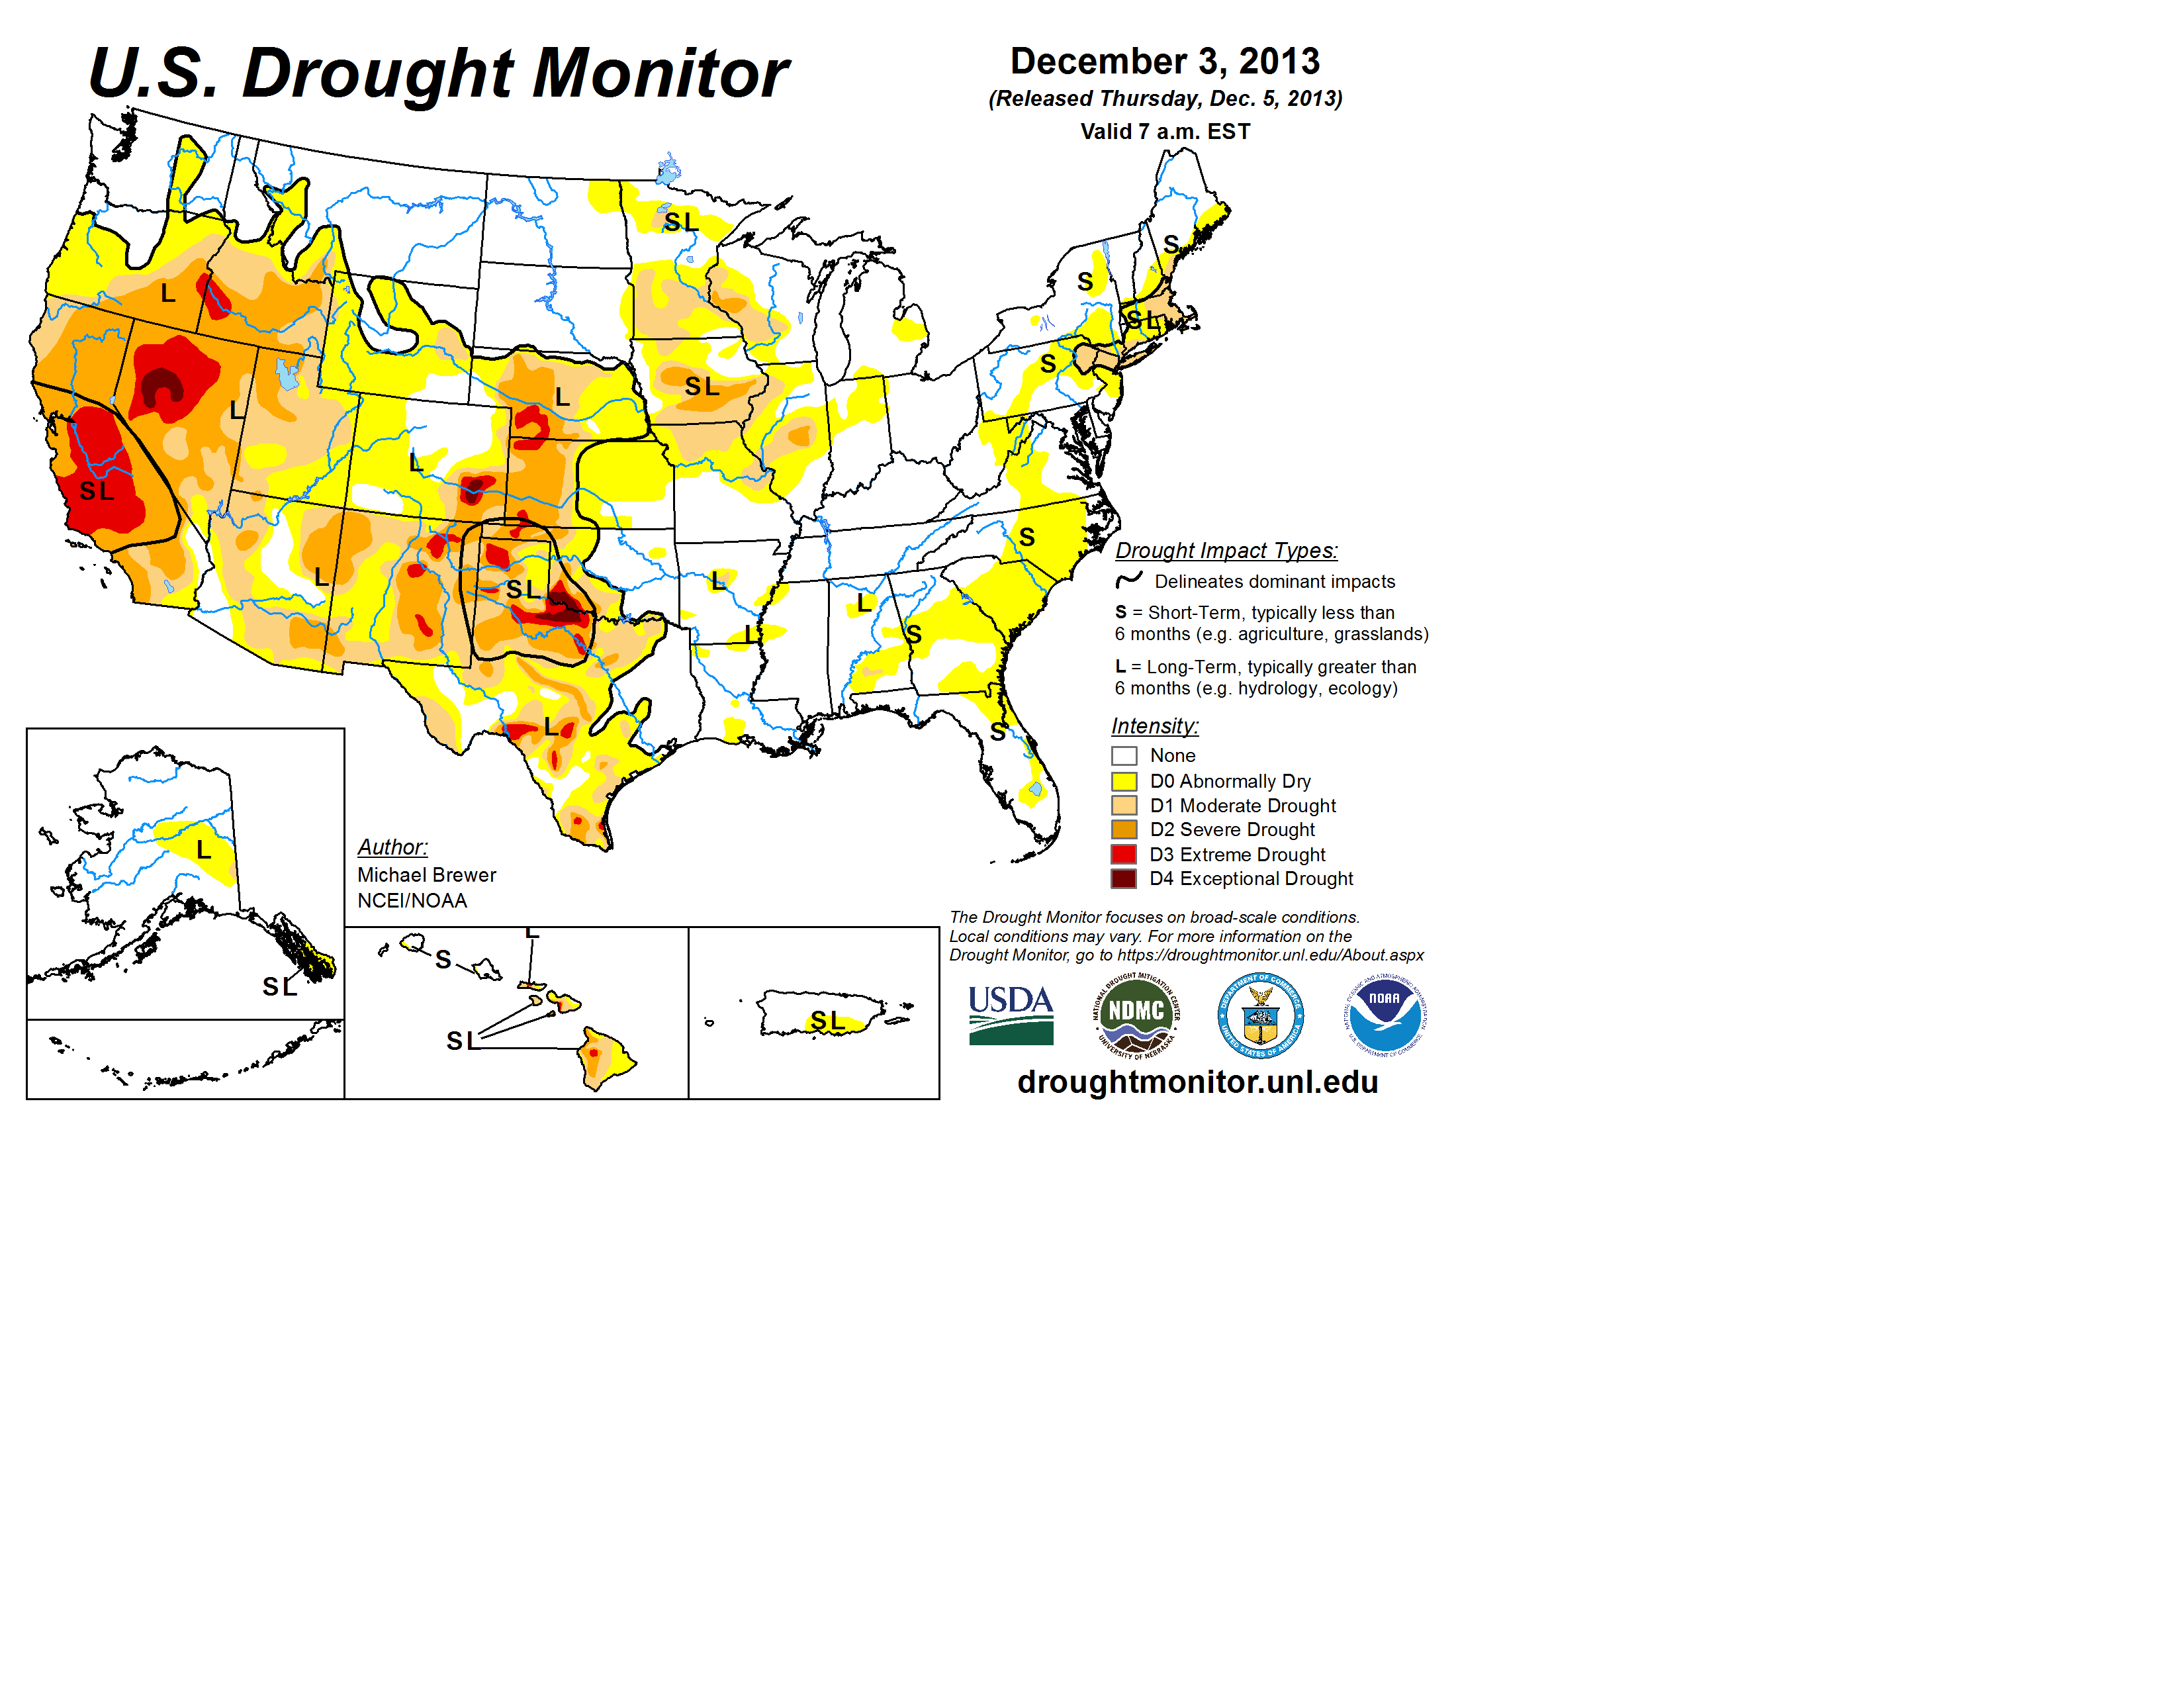
Half of the western United States (49.99 percent) is in moderate drought or worse. Drought covers 19.29 percent of the High Plains, 18.49 percent of the Midwest, 28.25 percent of the South (in Texas and Oklahoma), less than a quarter of one percent of the Southeast (in Alabama), and 7.5 percent of the Northeast.
Rippey said USDA analysis showed no changes to the proportion of the production areas in drought for hay (21 percent), winter wheat (30 percent), and cattle (34 percent).
U.S. Drought Monitor authors synthesize many drought indicators into a single map that identifies areas of the country that are abnormally dry (D0), in moderate drought (D1), in severe drought (D2), extreme drought (D3) and exceptional drought (D4). The map is released each week based on data through the previous Tuesday morning.
The U.S. Drought Monitor map is jointly produced by the National Drought Mitigation Center at the University of Nebraska-Lincoln, the National Oceanic and Atmospheric Administration, the USDA, and about 350 drought observers across the country. This week’s U.S. Drought Monitor author, Mike Brewer, is with NOAA’s National Climatic Data Center.
Statistics for the percent area in each category of drought are automatically added to the U.S. Drought Monitor website each week for the entire country and Puerto Rico, for the 48 contiguous states, for each climate region, and for individual states. U.S. Drought Monitor data online goes back to January 2000.
http://drought.unl.edu/MonitoringTools/USDroughtMonitor/DroughtMonitorTips.aspx
U.S. Drought Monitor map, statistics and narrative summary: http://droughtmonitor.unl.edu
U.S. Ag in Drought,
current: http://www.usda.gov/oce/weather/Drought/AgInDrought.pdf
archived: http://drought.unl.edu/Planning/Impacts/USAginDroughtArchive.aspx
U.S. Drought Monitor Change Maps: http://droughtmonitor.unl.edu/DataArchive/ChangeMaps.aspx
Drought Impact Reporter: http://droughtreporter.unl.edu
National Drought Mitigation Center’s Monthly Drought and Impact Summary
http://drought.unl.edu/NewsOutreach/MonthlySummary.aspx
National Climatic Data Center’s State of the Climate Drought Summary:
http://www.ncdc.noaa.gov/sotc/drought/
U.S. Monthly Drought Outlook:
http://www.cpc.ncep.noaa.gov/products/expert_assessment/mdo_summary.html
U.S. Seasonal Drought Outlook:
http://www.cpc.ncep.noaa.gov/products/expert_assessment/sdo_summary.html