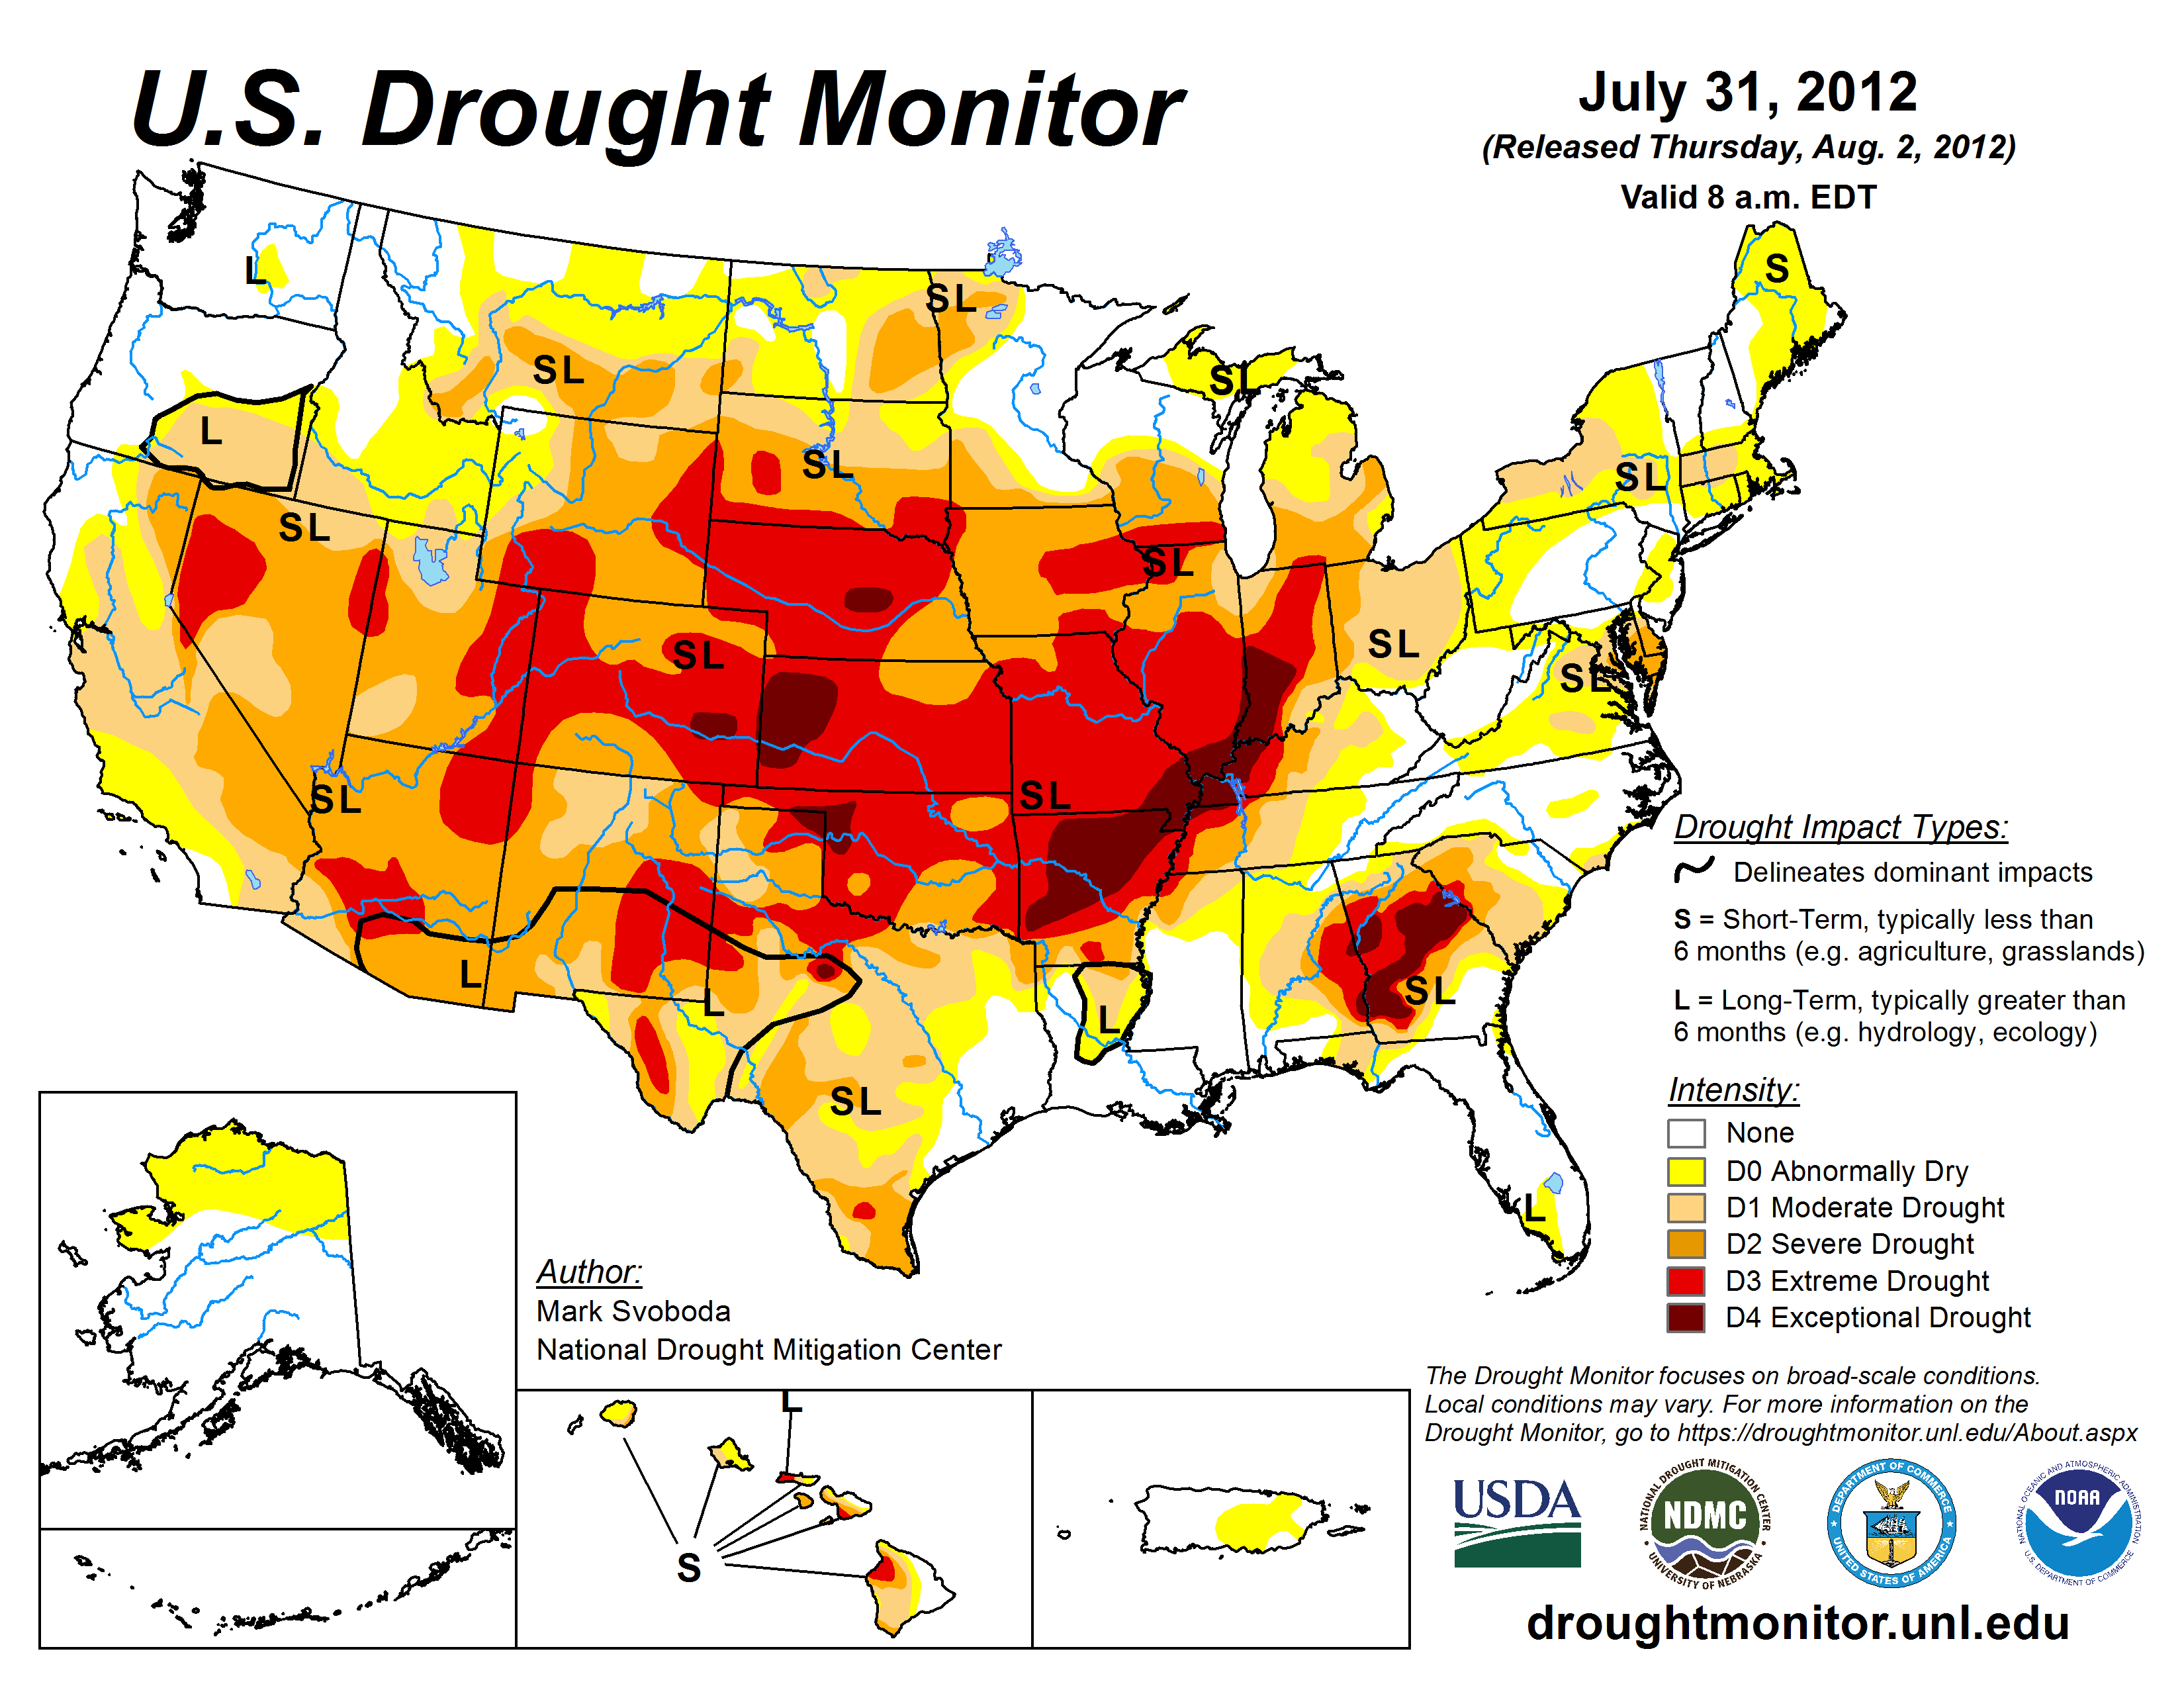
Drought intensified slightly over the Midwest and Great Plains states in the seven days that ended July 31, according to the U.S. Drought Monitor map released today.
“We saw drought continue to intensify over Nebraska, Kansas, Missouri, Oklahoma and Arkansas this week,” said Brian Fuchs, a climatologist and U.S. Drought Monitor author at the National Drought Mitigation Center, based at the University of Nebraska-Lincoln. “Pretty much all of Kansas, Missouri and Nebraska are now in extreme drought, and it expanded through much of Oklahoma.”
“It’s hard to believe that it’s getting worse, but it is, even with some rain in the region,” Fuchs said. “Drought continues to intensify through the Midwest and Plains states.”
Fuchs noted that good rains in parts of eastern Tennessee, West Virginia, west Texas and northern Colorado brought some relief. Statistics released with the map showed a slight reduction in the total area of the country in moderate drought.
The July 31 Drought Monitor map put 52.65 percent of the United States and Puerto Rico in moderate drought or worse, down from 53.44 percent the week before; 38.12 percent in severe drought or worse, compared with 38.11 a week earlier; 18.62 percent in extreme drought or worse, compared with 17.2 percent the week before; and 2.52 percent in exceptional drought, up from 1.99 percent the preceding week.
Based on the most recent Seasonal Drought Outlook, also released today, Fuchs said, “Drought will continue over much of the country through October. Some improvement is anticipated over the Southwest and up into Utah and Colorado due to a strong monsoon season, and improvements over the Southeast are expected too. Drought will persist over much of the rest of the current drought regions with further development over the Dakotas and into Montana as well as in portions of Texas.”
The total area of the country shown in moderate drought or worse has been setting records within the U.S. Drought Monitor’s 12-year history since mid-June. For longer comparisons, researchers look to the Palmer Drought Severity Index.
The U.S. Drought Monitor map is jointly produced by the National Drought Mitigation Center at the University of Nebraska-Lincoln, the National Oceanic and Atmospheric Administration, the U.S. Department of Agriculture, and about 350 drought observers across the country. It is released each Thursday based on data through the previous Tuesday.
Drought Monitor authors synthesize many drought indicators into a single map that identifies areas of the country that are abnormally dry (D0), in moderate drought (D1), in severe drought (D2), extreme drought (D3) and exceptional drought (D4).
Statistics for the percent area in each category of drought are automatically added to the U.S. Drought Monitor website each week for the entire country and Puerto Rico, for the 48 contiguous states, for each climate region, and for individual states: http://drought.unl.edu/MonitoringTools/USDroughtMonitor/DroughtMonitorTips.aspx
The National Climatic Data Center maintains drought data based on the Palmer Drought Severity Index, calculated to the beginning of the historic record: http://www1.ncdc.noaa.gov/pub/data/cmb/sotc/drought/2012/06/uspctarea-wetdry-mod.txt
U.S. Drought Monitor: http://droughtmonitor.unl.edu
Seasonal Drought Outlook: http://www.cpc.ncep.noaa.gov/products/expert_assessment/seasonal_drought.html
-- Kelly Helm Smith, National Drought Mitigation Center